Opening Range Breakout (ORB) – 15-Minute
Description
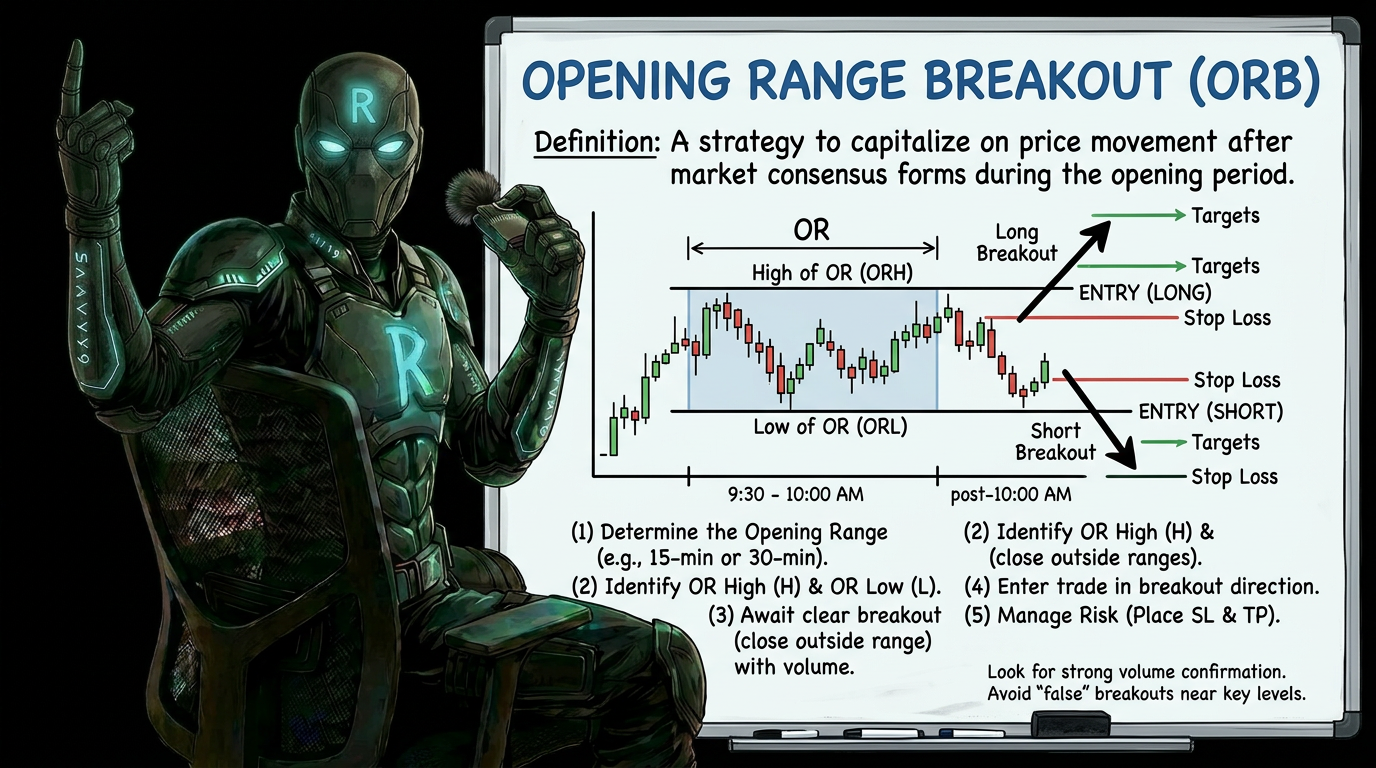
The 15-Minute ORB strategy defines the high and low of the first 15-minute candle (including wicks) after a major session open as the key support and resistance levels for the day. Traders wait for a confirmed breakout or breakdown of this range and trade in the direction of the break, using lower timeframes for scalp entries and the 15-minute chart for day-trade trend plays. The range also serves as a visual filter to distinguish trend days from choppy, inside-range days, helping traders decide whether to trade breakouts or fade the extremes.
Market Conditions
- First 15-minute candle has formed after session open— Wait for the full 15-minute candle to close before marking the ORB high and low, including wicks
- Trend day identified – price breaks outside ORB with confirming candle— Best results occur on trend days; choppy inside-ORB days call for fading the extremes instead
- Choppy/inside ORB day – price remains inside ORB for 6-7 candles— If price stays inside ORB for 6-7 candles, expect either a very choppy inside day or a large unexpected afternoon move; fade the extremes or reduce size
Setup Sequence
- 1
Mark the ORB
At 9:30 AM ET (or equivalent session open), wait for the first 15-minute candle to close. Draw horizontal lines at the candle's high and low, including wicks. These are your ORB high and ORB low for the session.
- 2
Classify the day
Monitor how price behaves inside the ORB. If 6-7 candles print without a clean break, classify as a choppy/inside day and fade the ORB extremes rather than trading breakouts. If price breaks cleanly, classify as a potential trend day.
- 3
Wait for ORB breakout or breakdown
On a trend day, wait for price to break above the ORB high (long bias) or below the ORB low (short bias). The break should be clean and ideally confirmed by the closing of a candle beyond the level.
- 4
Confirm the breakout
On the 15-minute chart, look for: a candle closing outside the ORB, a subsequent higher low (for longs) or lower high (for shorts), and no immediate reclaim of the ORB. On the 1-minute chart for scalps, look for a break of the minor structure in the direction of the ORB break.
- 5
Enter in the direction of the confirmed break
For longs: enter after ORB high breaks with confirmation. For shorts: enter after ORB low breaks with confirmation. On choppy days, short near ORB high and long near ORB low as a range-fade approach.
- 6
Monitor for invalidation
On a long trade, a lower low (break of the most recent swing low) invalidates the uptrend. Exit and consider reversing short. On a short trade, a higher high invalidates the downtrend. Always respect break-of-structure signals as exit cues.
Entry Trigger
Stop Placement
Management Rules
- •Take partial profits quickly on scalp timeframes
- •Exit immediately on break-of-structure against position
- •Reduce or avoid trading on confirmed choppy/inside ORB days
- •Use midpoint of ORB as intraday support/resistance on choppy days
Common Mistakes
- •Entering on the wick break rather than waiting for candle close confirmation
Fix: Wait for the 15-minute candle to close outside the ORB before committing to a breakout trade; wicks alone are not confirmation
- •Trading breakouts on choppy inside-ORB days
Fix: If 6-7 candles have printed inside the ORB without a clean break, switch to range-fade mode or stand aside entirely
- •Ignoring invalidation signals and holding losing trades
Fix: When price prints a lower low on a long or higher high on a short, treat it as a break-of-structure and exit immediately; do not hold hoping for recovery
- •Using this strategy on 24-hour instruments outside major session opens
Fix: Only apply the ORB to the first 15-minute candle of a major session open (NYSE, London, Asia); random 15-minute candles during off-hours have no edge
- •Overcomplicating the setup with too many indicators
Fix: The ORB is two horizontal lines and candlestick price action. Adding excessive indicators often introduces noise; keep it simple with just the ORB levels and structure
Frequently Asked Questions
What is the 15-Minute Opening Range Breakout (ORB) strategy?
The 15-Minute ORB strategy uses the first 15-minute candle of a major trading session to set two key price levels: the high and the low. These levels act as a zone of support and resistance for the rest of the day. Traders watch to see if price breaks above or below this range, then trade in that direction.
How do I know when a breakout is confirmed?
A breakout is confirmed when a 15-minute candle fully closes beyond the ORB high or low. A wick poking past the level does not count. For day trades, wait for that candle close. For quicker scalp trades, you can drop to the 1-minute chart and look for a small break of structure in the breakout direction.
Where should I place my stop loss?
For a long trade, place your stop below the most recent swing low. For a short trade, place it above the most recent swing high. If there is no clear swing point, you can set the stop just inside the ORB range. The most important rule: if price makes a lower low on a long or a higher high on a short, exit right away — do not wait and hope.
What is a choppy day and how should I trade it differently?
A choppy day is when price keeps bouncing back and forth inside the ORB range without making a clean break. If you see 6 or 7 candles still stuck inside the range, it is a sign the market is not trending. On these days, you can try fading the extremes — meaning buy near the low and sell near the high — or just stay out of the market entirely.
Can I use the ORB strategy on any market at any time?
No. This strategy only works well at the start of major trading sessions, like the NYSE open, the London open, or the Asia open. Applying it to random 15-minute candles during off-hours or quiet periods does not give you a real edge. The power of the ORB comes from the high activity that happens right when major markets open.
Do I need a lot of indicators to use this strategy?
No. The ORB strategy is designed to be simple. All you really need are two horizontal lines marking the high and low of the first 15-minute candle, plus basic candlestick price action. Adding too many indicators can make things confusing and hurt your results. Keep it clean and straightforward.
What is the biggest mistake traders make with the ORB?
One of the most common mistakes is entering a trade when a wick breaks the ORB level, without waiting for the candle to fully close outside it. Wicks alone are not confirmation. Another big mistake is holding a losing trade when the market is clearly moving against you. If price breaks structure against your position, exit right away instead of waiting for it to recover.
What is the difference between using the ORB for scalps versus day trades?
For scalps, you switch to the 1-minute chart after the ORB is set and look for a quick break of structure in the direction of the breakout. This is a faster, shorter trade. For day trades, you stay on the 15-minute chart and wait for a full candle close confirmation before entering. Day trades aim to capture a bigger move over more of the trading session.