Double Bottom — Definition & How to Trade It | runic.tools
Definition
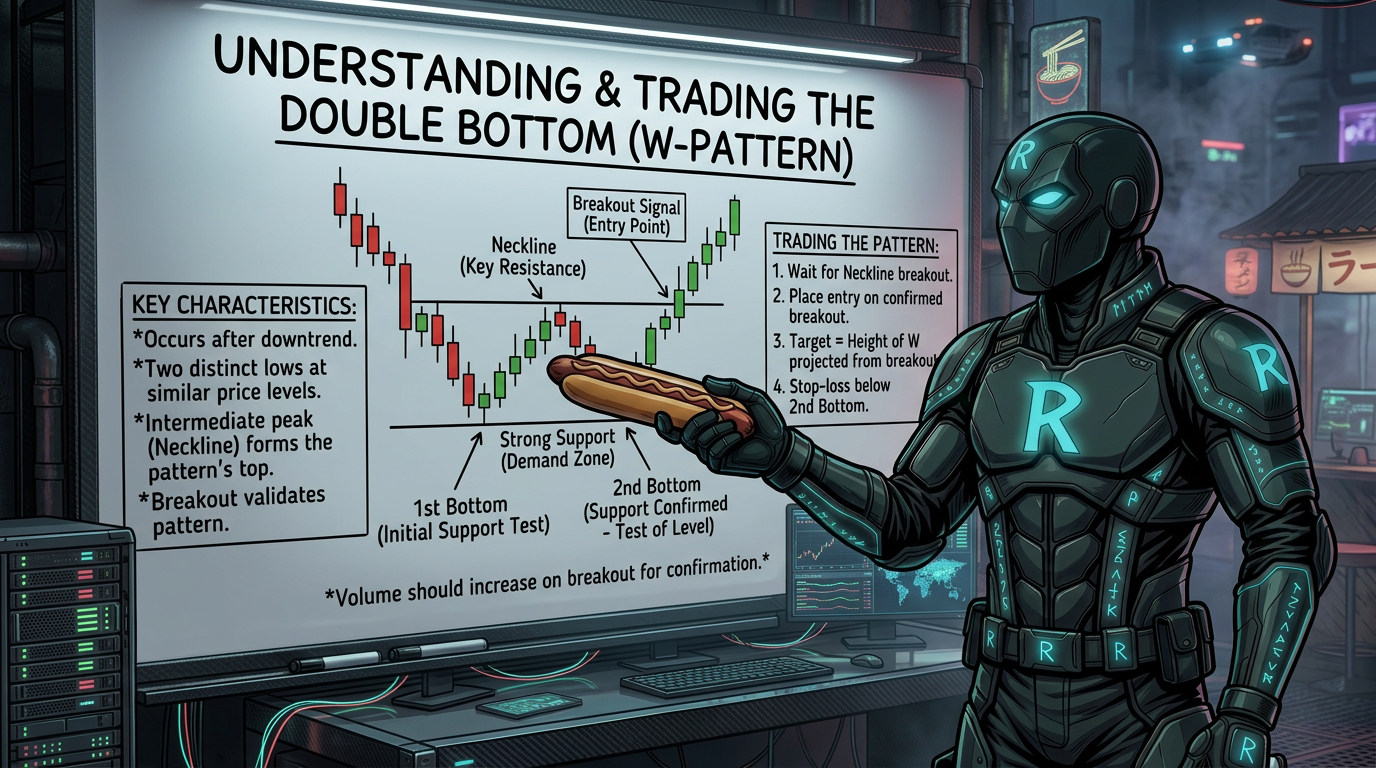
A double bottom is a chart pattern where price drops to a support level, bounces up, then falls back down to test that same level again before reversing higher. It looks like the letter W on a price chart.
Explanation
A double bottom forms when price hits a support level twice without breaking below it. The first touch creates a low. Price then bounces up before sellers push it back down to test that same area. If price holds at the second low and bounces again, that is the double bottom confirmation. Traders use this as a signal to buy, expecting price to move higher. The tricky part is knowing whether the second bounce is real or if price will just keep falling. One way to confirm a true double bottom is to check the RSI (Relative Strength Index). If price makes two equal lows but the RSI makes a higher low on the second dip, that is called bullish divergence. It means momentum is weakening on the downside and a reversal is likely. This strategy works best on higher time frames like the 15-minute chart or above. Lower time frames like the 1-minute or 5-minute chart have weaker support and resistance levels and produce too many false signals. When entering a trade on a double bottom, place your stop loss just below the lowest wick of the second bottom. Target a 1-to-2 risk-to-reward ratio, meaning you aim to make twice what you risk.
Example
A trader spots a double bottom on the US30 15-minute chart at 33,762. The RSI shows a higher low on the second dip, confirming bullish divergence. The trader enters a long position after the bounce candle closes and collects 200 points on the move up.
Why It Matters
Double bottoms are one of the most common reversal patterns in trading. Knowing how to confirm them with RSI divergence helps traders avoid false signals and enter trades with better timing and higher confidence.
Common Misconceptions
Reality: Equal lows alone are not enough. You need to see a strong rejection candle and confirm bullish RSI divergence before entering. Without confirmation, it could become a triple bottom or a full breakdown.
Reality: Lower time frames like the 1-minute or 5-minute chart produce weak support and resistance levels. Double bottoms are much more reliable on the 15-minute chart and higher.
Reality: You should wait for a clear rejection candle first. Entering too early risks getting caught in a continued move lower.
Frequently Asked Questions
What does a double bottom look like on a chart?
It looks like the letter W. Price drops to a low, bounces up, drops back down to roughly the same level, then bounces up again.
How do I know the second low will hold and not break lower?
Wait for a strong rejection candle at the second low. Then check the RSI. If the RSI made a higher low compared to the first dip, that is bullish divergence and a good sign the level will hold.
What is RSI divergence and why does it matter here?
RSI divergence happens when price makes the same low twice but the RSI shows a higher low. This means selling momentum is fading. It supports the idea that a reversal is coming.
Where do I place my stop loss on a double bottom trade?
Place your stop loss just below the lowest wick of the second bottom. This keeps your risk small while giving the trade room to work.
What time frames work best for trading double bottoms?
The 15-minute chart and higher work best. Lower time frames like the 1-minute or 5-minute chart have weak support levels that produce too many false double bottom signals.
What is a good risk-to-reward ratio for a double bottom trade?
Aim for at least 1-to-2. That means for every dollar you risk, you are targeting two dollars in profit.
What is the difference between a double bottom and a triple bottom?
A double bottom tests the support level twice. A triple bottom tests it three times before reversing. The risk with any double bottom is that it could become a triple bottom, which is why confirmation before entering is so important.
Does the double bottom pattern also work on the short side?
Yes. The opposite is called a double top. Price tests a resistance level twice and fails both times. RSI divergence on the downside, called bearish divergence, can confirm a short trade at the second high.