Sell Side Liquidity — Pattern Reference | runic.tools
Identification Rules
- Find a swing low: a candle low with a higher low on both the left and the right side.
- Look for equal lows or relatively equal lows — two or more swing lows at nearly the same price level.
- Mark previous session lows (Asia, London, New York) as potential sell side targets.
- Mark previous day's low and previous week's low as higher-timeframe sell side levels.
- The more obvious and visible the low, the more stop orders are likely resting below it.
Entry Rules
- Wait for price to sweep below the sell side liquidity level (take out the low).
- Look for a displacement candle or break of structure to the upside after the sweep.
- Look for a fair value gap (FVG) created during the displacement and wait for price to retrace into it.
Stop Rules
- Place stop below the candle low that swept the sell side liquidity.
- Do not place stop directly at the swept low — give a few ticks of buffer below it.
Target Rules
- Target the next obvious buy side liquidity level above price (swing high, equal highs).
- Use session highs (Asia high, London high) or previous day/week highs as upper targets.
- Consider partial profit at a nearby fair value gap or short-term high before the main target.
Confluence Factors
- Sweep occurs during a high-probability session (London open or New York open).
- Displacement candle after the sweep closes back above the swept low convincingly.
- Fair value gap aligns with a higher-timeframe support level.
- Equal lows present instead of a single swing low — more stops clustered at that level.
- Previous day low or previous week low aligns with the sweep level.
- Asia session low is swept heading into London or New York open.
Failure Modes
- No displacement after the sweep
- Price continues lower after the sweep
- Entry on sweep candle without confirmation
- Misidentified swing low
Common Mistakes
- Marking every minor low as sell side liquidity.
- Entering on the sweep before price shows any reversal signal.
- Ignoring higher-timeframe session and daily levels.
- Using sell side liquidity in isolation without a draw on liquidity above.
- Treating equal lows the same as a single swing low.
Frequently Asked Questions
What is sell side liquidity?
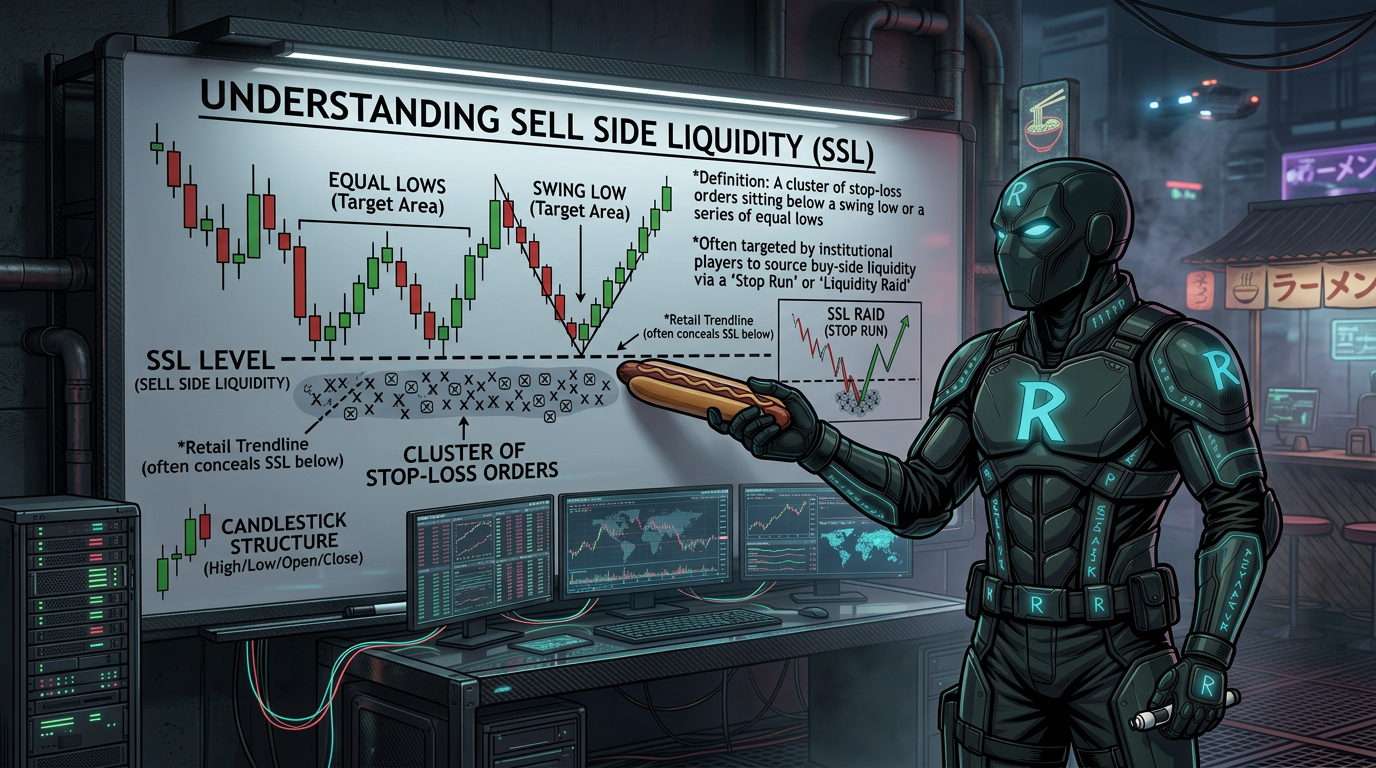
Sell side liquidity is a pool of stop-loss orders sitting below a swing low or equal lows. Retail traders who are long put their stops there. Smart money targets these stops, sweeps below the low to fill their own orders, then pushes price higher.
What is the difference between sell side and buy side liquidity?
Sell side liquidity sits below swing lows where long traders have their stops. Buy side liquidity sits above swing highs where short traders have their stops. Smart money hunts both sides depending on where they want to go next.
How do I spot a sell side liquidity level on a chart?
Look for a swing low — a low candle with higher lows on both sides. If two or more lows sit at nearly the same price level, those are equal lows and carry even more stops. The more obvious the level, the more liquidity is likely resting there.
Does price always reverse after sweeping sell side liquidity?
No. A sweep does not guarantee a reversal. You need to see a strong displacement candle moving back up and ideally a break of short-term structure before entering. If price just keeps grinding lower, the setup has failed.
What session times produce the best sell side liquidity sweeps?
London open and New York open are the most common times to see sell side sweeps. The Asia session low is a frequent target heading into London. These sessions bring volume and are when smart money is most active.
What liquidity levels should I always have marked on my chart?
At a minimum, mark the previous week's high and low, the previous day's high and low, and the current session highs and lows (Asia, London, New York). These are the most watched levels and give you a roadmap for where price is likely drawn.
What is the difference between a single swing low and equal lows?
A single swing low is one clear low point that sticks out on the chart. Equal lows are two or more lows at nearly the same price level. Equal lows tend to attract more stops because they are easy to see, so they often act as a stronger sell side target.
How do I set a target after a sell side liquidity sweep?
After price sweeps below a swing low and shows a reversal, your target is the next obvious pool of buy side liquidity above price — such as a swing high, equal highs, or a previous session or day high. That is the logical draw on liquidity for the next move up.