Support and Resistance — Pattern Reference | runic.tools
Identification Rules
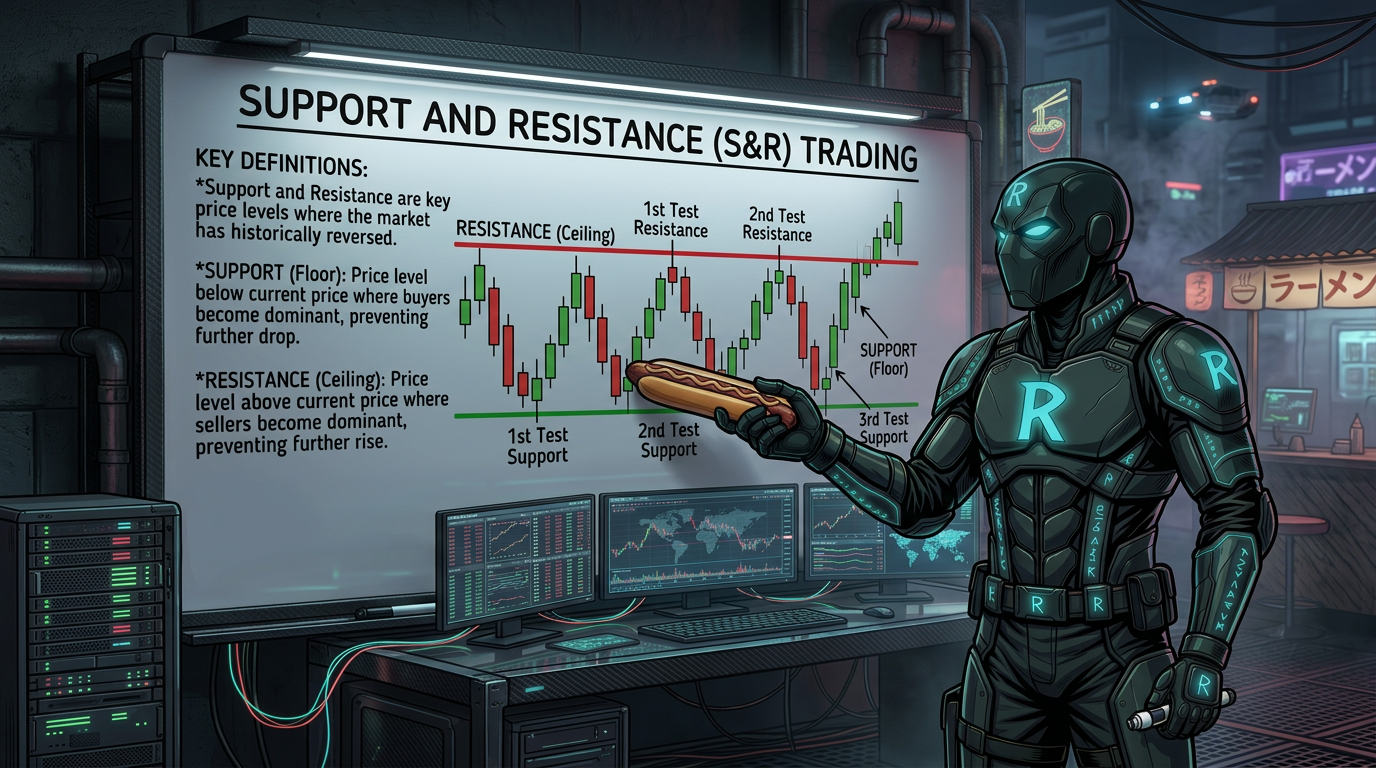
- Find areas where price has clearly reversed or bounced at least once
- Mark the level from the candle body open or close, not the wick tip
- Treat the level as a zone or area, not one exact price
- Start on the monthly chart, then work down to weekly and daily
- Multiple rejections at the same area confirm it is a stronger level
- A broken resistance level becomes a new support, and a broken support becomes new resistance
- Avoid marking too many levels close together — keep only the most significant ones
Entry Rules
- Go long when price returns to a support zone and shows bullish confirmation
- Go short when price returns to a resistance zone and shows bearish confirmation
- After a resistance level breaks and flips to support, look to go long on a retest of that new support
- After a support level breaks and flips to resistance, look to go short on a retest of that new resistance
Stop Rules
- Place your stop loss below the swing low when going long at support
- Place your stop loss above the swing high when going short at resistance
Target Rules
- Target the next significant resistance level above when going long
- Target the next significant support level below when going short
Confluence Factors
- Higher time frame level aligns with your trade direction
- Multiple rejections at the same zone in the past
- Bullish or bearish confirmation candle forms at the level
- Resistance breaks and flips to support before entry
- Level overlaps with a weekly or monthly zone
- Price wicks through the zone slightly before closing back above or below
- Lower time frame structure aligns with higher time frame level
Failure Modes
- Level breaks without reversing
- Wick through and close beyond the zone
- Weak trend momentum overwhelms the level
- Level is too close to other levels to be meaningful
Common Mistakes
- Drawing too many levels on the chart
- Marking levels from the wick tip instead of the candle body
- Treating a support or resistance level as a single exact price
- Ignoring level flips
- Not organizing levels by time frame
- Entering without waiting for confirmation
Frequently Asked Questions
What is the difference between support and resistance?
Support is a price level below the current price where buyers have stepped in before. Resistance is a price level above the current price where sellers have pushed price down before. A simple rule: support is below price, resistance is above it.
What does it mean when support or resistance flips?
When price breaks through a resistance level, that level can flip and become a new support. The opposite is also true — when support is broken, it can become resistance. These flipped levels are popular trade setups because old trapped traders create buying or selling pressure when price returns.
Should I draw my levels from the candle wick or the candle body?
Draw from the candle body, specifically the open or close. Wicks represent extreme price spikes that do not always repeat. Using the body gives you a more reliable level.
How many support and resistance levels should I have on my chart?
Keep it simple. Start on the monthly chart and mark the most obvious levels. Work down to the weekly, then daily. Only add a lower time frame level if it is not already covered by a higher time frame one. The goal is a clean chart, not a crowded one.
Does a level get stronger the more times it is tested?
Not exactly. Multiple rejections confirm that the level is significant. But each time the level is tested, it gets slightly weaker because the trapped traders who created the level are slowly being cleared out. A level tested many times has a higher chance of eventually breaking.
What is a support or resistance zone?
Instead of one exact price, a zone is a small price range where the market tends to react. Price does not always stop at the exact same number every time. Treating it as a zone helps you avoid being stopped out by a small wick that goes slightly past your level.
How do I avoid having too many levels on my chart?
Start on the monthly time frame and only mark the clearest, most obvious levels. When you drop to a lower time frame, skip any level that is already covered by a higher time frame one. Use TradingView's Object Tree to organize your levels into folders by time frame so your chart stays clean.
How do I know when to enter a trade at support or resistance?
Wait for confirmation. At support, look for a bullish candle pattern like a bullish engulfing candle before entering long. At resistance, look for a bearish rejection candle before entering short. Do not enter just because price touched the level — wait for the market to show you it is reacting.