Top-Down Time Frame Analysis — Multi-Time Frame Bias Guide | runic.tools
Identification Rules
- Identify a clear higher time frame draw on liquidity — a pool of buy-side or sell-side liquidity that price is likely heading toward.
- Look for a significant price event on the higher time frame, such as a failed break above a major swing high or a close back inside a range.
- Confirm the higher time frame bias before touching lower time frame charts.
- Mark the premium and discount zones of the higher time frame range so you understand where price is relative to value.
- Note how many weeks, days, or sessions it may take for price to reach the higher time frame draw on liquidity.
Entry Rules
- Drop to lower time frames (4H, 1H, 15M, 5M) only after the higher time frame bias is confirmed.
- Look for short-term runs on liquidity that go against your bias as entry opportunities, not as reasons to flip your bias.
- Enter on lower time frame confirmation after a short-term liquidity grab aligns with your higher time frame direction.
- All entries on the 1H, 15M, and 5M should point in the same direction as the weekly or daily bias.
Stop Rules
- Place stops beyond the short-term liquidity level that was just taken out.
- Do not widen stops to match the higher time frame swing — use the lower time frame structure for stop placement.
Target Rules
- The primary target is always the higher time frame draw on liquidity.
- Use intermediate short-term lows or liquidity pools as partial targets on the way to the higher time frame target.
- Expect multiple weeks or sessions for price to reach the HTF target — do not rush the exit.
Confluence Factors
- Failed break of a major higher time frame swing high or low followed by a close back inside the range.
- Price trading at the premium end of a higher time frame range when bearish, or the discount end when bullish.
- Clear untapped liquidity pool visible on the weekly or daily chart acting as a magnet for price.
- Lower time frame entries align with higher time frame bias direction.
- Short-term liquidity sweeps against the HTF trend that trap retail traders on the wrong side.
- Multiple time frames (daily, 4H, 1H) all showing the same directional bias.
Failure Modes
- Bias flip from low time frame noise
- Treating counter-trend bounces as reversals
- Only trading the higher time frame candle
- No defined draw on liquidity
Common Mistakes
- Starting analysis on the lowest time frame available.
- Changing your bias every time the market ticks against you on a low time frame.
- Not identifying a clear draw on liquidity before trading.
- Thinking top-down analysis limits you to only a few trades per month.
- Going long on a short-term bounce during a bearish HTF trend.
Frequently Asked Questions
What does top-down analysis mean in trading?
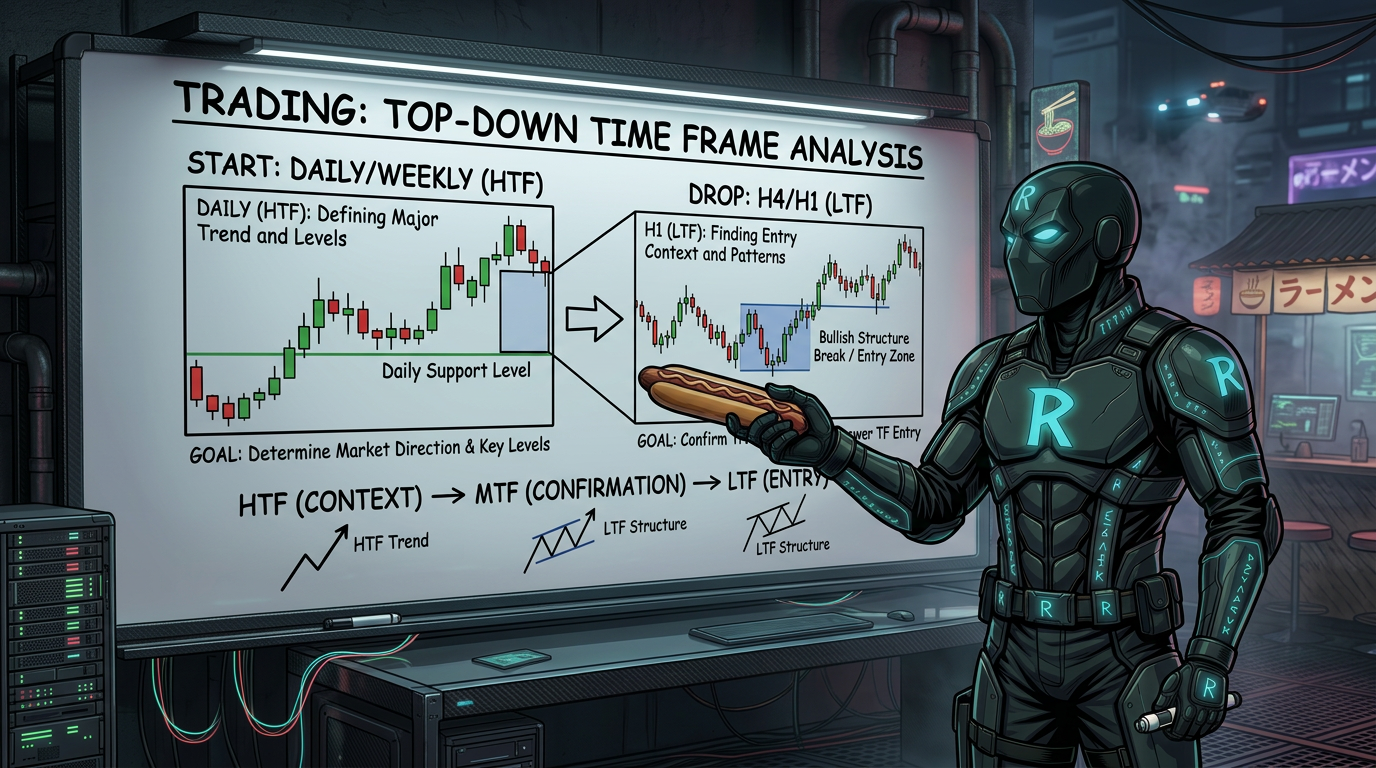
Top-down analysis means you start on a high time frame like the weekly or daily chart to figure out the market's overall direction. Once you know that direction, you move to lower time frames like the 1-hour or 15-minute chart to find specific entries that line up with it.
Does using higher time frames mean I can only take a few trades per month?
No. The higher time frame just gives you your bias — the direction you want to trade. You can still scalp, day trade, or swing trade on lower time frames. All those trades just need to point in the same direction as your higher time frame view.
What time frames should I use for top-down analysis?
A common approach is to start on the weekly chart to set your big-picture bias, then use the daily and 4-hour to refine direction, then drop to the 1-hour, 15-minute, or 5-minute for actual entries.
What is a draw on liquidity and why does it matter?
A draw on liquidity is a price level where a lot of stop orders or trapped traders are sitting — usually above a swing high or below a swing low. Price tends to move toward these levels. Knowing where the higher time frame draw on liquidity is tells you where price is probably heading.
What should I do when price moves against my bias on a low time frame?
Stay calm and check whether your higher time frame reason for the trade is still valid. Short-term moves against your bias are normal and often just liquidity grabs. Only change your bias if the higher time frame structure has actually changed.
Can I use top-down analysis for day trading or scalping?
Yes. Even if you only hold trades for a few minutes or hours, knowing the higher time frame direction makes those trades more accurate. You avoid fighting the bigger trend and you know which side of the market to be on.
How do I know when the higher time frame bias is confirmed?
Look for a clear event like price taking out a major swing high or low and then closing back inside the range, or price reaching the premium or discount end of a large range and showing rejection. That kind of price behavior signals where the market is likely heading next.
Why do counter-trend bounces happen during a strong trend?
Counter-trend bounces usually happen because price is sweeping short-term liquidity — running stops above recent highs to trap buyers before continuing in the original direction. In a bearish trend, these bounces look tempting to buy but are often just setups for more selling.