Fibonacci Retracement — Pattern Reference | runic.tools
Identification Rules
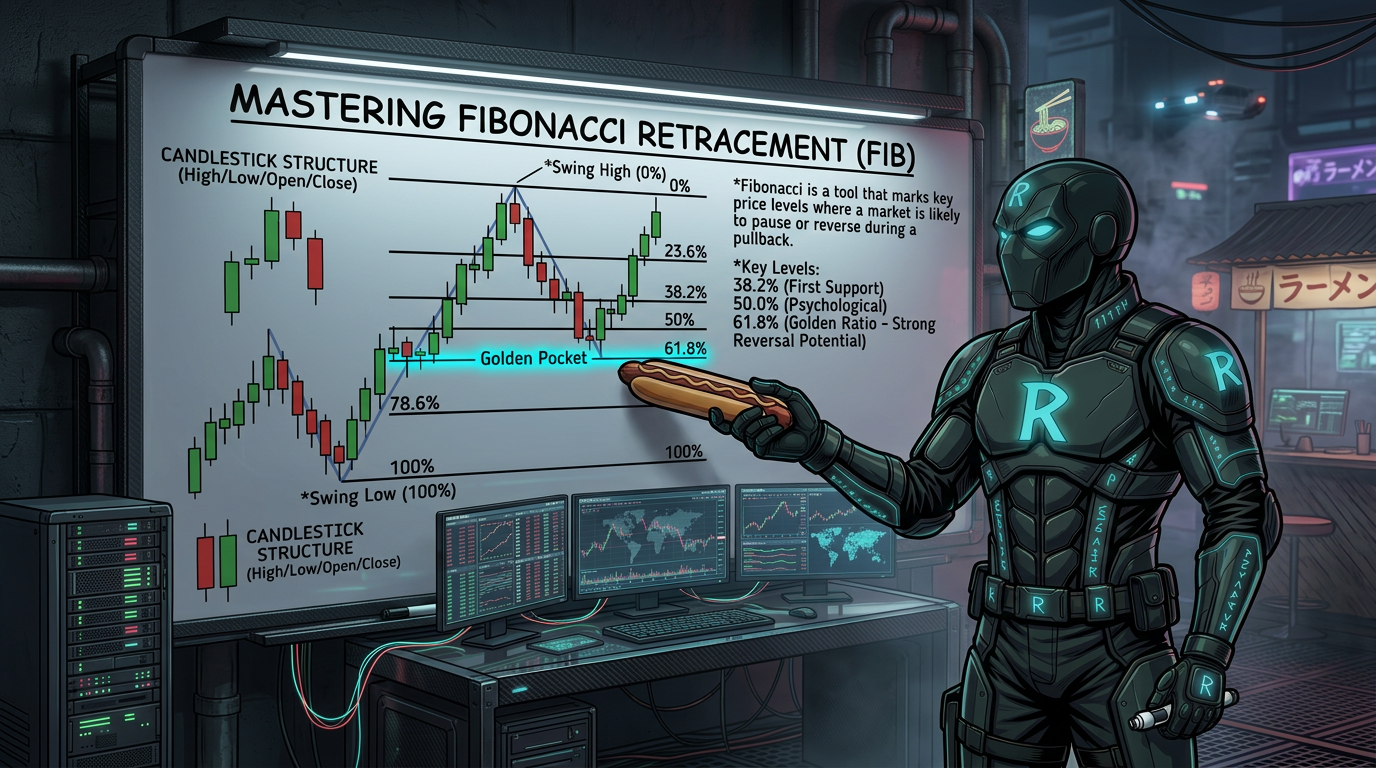
- Identify a clear swing high and swing low on the chart.
- Market structure must show a trend — a series of higher highs and higher lows, or lower highs and lower lows.
- Price must fail to continue the trend before you draw the Fibonacci tool, signaling a potential reversal.
- Draw the tool from the most recent swing low to swing high for a bullish setup, or swing high to swing low for a bearish setup.
- Fibonacci levels are more reliable on higher time frames than lower time frames.
Entry Rules
- Wait for price to pull back into the Golden Zone (0.5 to 0.618 level).
- Look for a price action reversal signal inside the Golden Zone before entering.
- Confirm with RSI divergence if available — a lower low in price paired with a higher low on RSI is a strong signal.
- Smaller time frame Fibonacci setups can still provide valid scalp entries on the 5-minute chart.
Stop Rules
- Place your stop loss below the swing low for a bullish trade, or above the swing high for a bearish trade.
- A close beyond the 0.786 level or the full swing point suggests the trade idea is wrong.
Target Rules
- Take Profit 1: The prior swing high (or low for bearish trades) — price is very likely to revisit this level.
- Take Profit 2: The -0.382 extension level.
- Take Profit 3: The -0.618 extension level.
- Take Profit 4: The -1.618 extension level.
Confluence Factors
- RSI divergence at the Golden Zone (price makes a lower low but RSI makes a higher low)
- Double bottom or double top forming at the 0.5–0.618 zone
- Higher time frame alignment — setup appears on the 1-hour, 4-hour, or daily chart
- Prior support or resistance level lining up with the Golden Zone
- Strong and fast initial move before the retracement — shows real momentum
- Clear prior price targets or structure levels near take profit zones
Failure Modes
- Price blows through the Golden Zone without reversing
- No confirmation signal inside the Golden Zone
- Drawing the tool from the wrong swing points
- Ignoring the bigger trend
Common Mistakes
- Entering as soon as price touches the Golden Zone
- Using the wrong swing points to draw the tool
- Setting only one take profit target
- Treating all time frames equally
- Skipping the tool settings setup
Frequently Asked Questions
What is the Fibonacci Golden Zone?
The Golden Zone is the area between the 0.5 and 0.618 Fibonacci levels. It is the most important zone for finding trade entries because price tends to pause or reverse there during a pullback.
Where do I start and end the Fibonacci drawing?
For a bullish setup, draw from the swing low to the swing high. For a bearish setup, draw from the swing high to the swing low. Always anchor the tool to the most recent clear swing points on your chart.
Should I enter a trade as soon as price hits the Golden Zone?
No. You should wait for a confirmation signal first. Look for a reversal candle pattern, a double bottom, or RSI divergence before entering. Entering blindly at a level is risky.
What is RSI divergence and why does it matter here?
RSI divergence happens when price makes a lower low but the RSI indicator makes a higher low. This suggests the downward move is losing steam and a reversal may be coming. It is a strong confirmation signal inside the Golden Zone.
Where should I set my take profit targets?
Your first target is the prior swing high (or low for bearish trades). If momentum is strong, your next targets are the -0.382 and -0.618 extension levels. In very strong trends, the -1.618 extension is your final target.
Do Fibonacci levels work on all time frames?
Yes, but they are more reliable on higher time frames like the 1-hour, 4-hour, or daily chart. You can still use them on lower time frames like the 5-minute chart for scalps, but be aware the signals are less consistent.
What happens if price breaks below the Golden Zone?
If price closes well below the 0.618 level or breaks the original swing low, the trade setup is likely invalid. The trend may have reversed. You should exit or avoid the trade.
Why do Fibonacci levels seem to work?
Fibonacci ratios appear naturally in patterns found in nature and human behavior. In trading, many participants watch the same levels, which can cause price to actually react there. The 0.5 and 0.618 levels are also strong psychological levels where traders see price as being 50% or 60% off its recent move.