The First Candle Strategy: How to Scalp the Market Open
Why Simple Beats Complex
Most traders lose money because they use too many strategies and too many indicators. RSI, MACD, Bollinger Bands, VWAP — when you stack all of these on a chart, you get conflicting signals. That causes hesitation. Hesitation causes missed trades or bad entries. The fix is to strip everything back. Focus on one clean setup. The simpler your approach, the easier it is to act with confidence.
Step 1 — Mark the First 5-Minute Candle
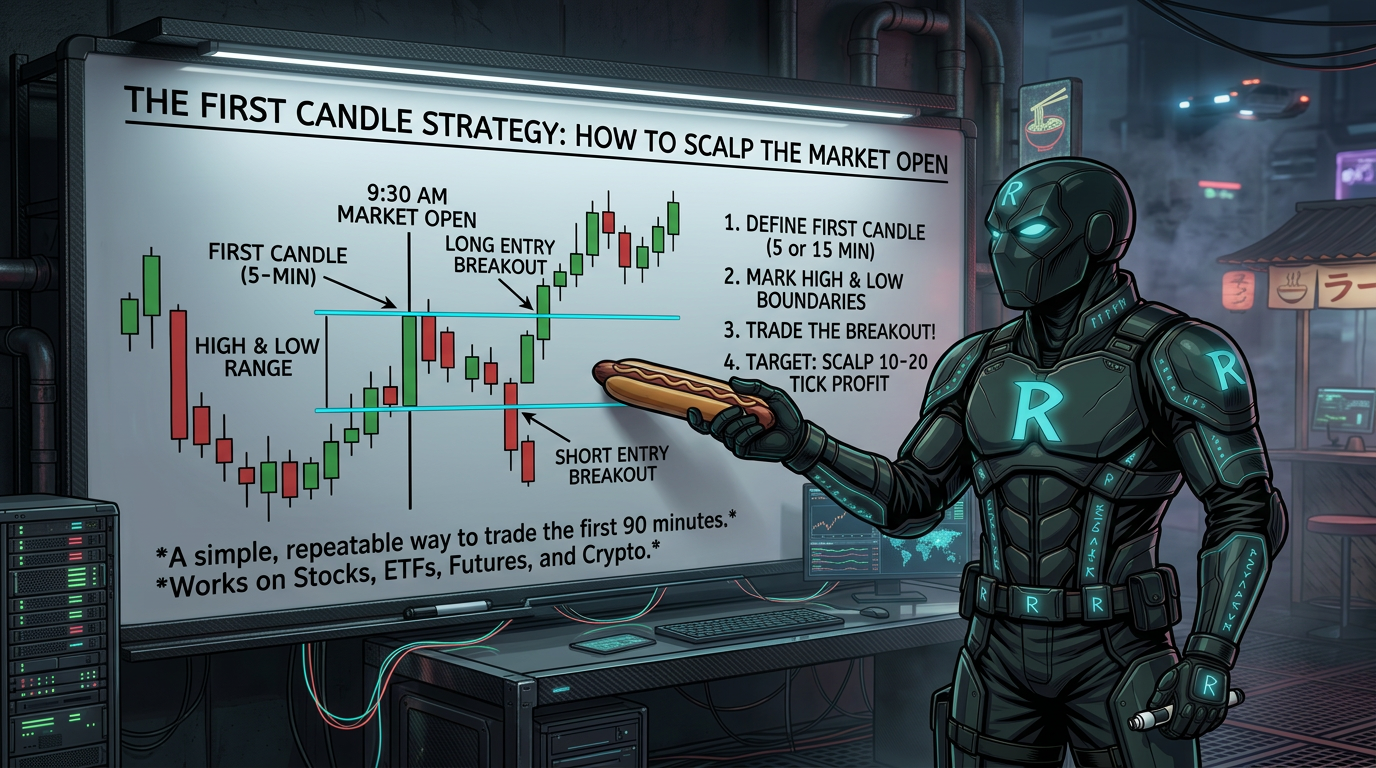
The New York session opens at 9:30 a.m. Eastern Time. Wait for the first 5-minute candle to fully close. Once it closes, draw a horizontal line at the high of that candle and another at the low. These two levels are your opening range. They act as magnets for price throughout the morning session. This setup works the same way on NQ futures, SPY, Tesla, Nvidia, or any liquid market.
Step 2 — Wait for a Strong Candle Break
Do not enter just because price moves past the high or low. You need a strong candle close above the high or below the low. A weak candle close means the move has no conviction — skip it. A strong close confirms that buyers or sellers are in control. If price closes strongly below the opening range low, you are looking for shorts. If it closes strongly above the range high, you are looking for longs. No strong close means no setup.
Step 3 — Wait for the Retest and Enter
After the break, price will often pull back to retest the level it just broke through. That retest is your entry zone. For a short trade, price breaks below the range low, then pulls back up to retest that low from underneath. That is where you look to sell. For a long trade, price breaks above the range high, then pulls back down to retest it from above. That is where you look to buy. Use the 1-minute chart to time your entry. Target a minimum 1:2 risk-to-reward ratio.
Common Mistake 1 — Stop Loss Too Tight
One of the biggest mistakes is placing your stop too close to your entry. Price almost always wiggles before it moves in your direction. If your stop is too tight, you get taken out before the trade works. Give your stop room by placing it at the nearest real market structure level. On the 5-minute chart, that could be the low of the second candle after your entry. As long as the 5-minute structure is still intact, you can stay in the trade.
Common Mistake 2 — Not Waiting for Candle Closes
Many traders enter or exit based on where price is mid-candle. This leads to getting shaken out of good trades. A wick above or below a level does not mean the level broke. What matters is where the candle closes. If price wicks above the range low but closes back underneath, the structure is still intact. If you are using hard stops, give them extra room to account for wicks. If you prefer mental stops, wait for the candle close before making any decision.
Re-Entry and Reclaim Setups
Getting stopped out does not mean the trade idea is wrong. If price stops you out but then closes back through your level in the original direction, that is a re-entry or reclaim setup. For example, if you are short and price wicks above the range low to stop you out, then closes back below it — you can re-enter short. The setup is still valid. The reclaim entry often has a better risk-to-reward because price has already shown it respects the level.
Using Confluence to Strengthen Your Entry
The opening range levels become even stronger when they line up with other key areas. An order block, a 1-minute range low, or a prior support zone near your 5-minute level adds confluence. When multiple factors stack up at the same area, the probability of a reaction increases. You do not need to label every confluence separately. Just treat the whole zone as one strong area and look for price to reject from it.
Frequently Asked Questions
What timeframe should I use for scalping NQ with this strategy?
Use the 5-minute chart to identify the opening range and mark your key levels. Then drop to the 1-minute chart to time your entry on the retest. The 5-minute chart gives you the structure, the 1-minute chart gives you precision.
What time does the setup happen?
The New York stock and futures session opens at 9:30 a.m. Eastern Time. The first 5-minute candle closes at 9:35 a.m. That is when you mark your levels and start watching for a break.
Does this strategy work on NQ futures, or only stocks?
It works on any liquid market with a clear session open. That includes NQ futures, ES futures, stocks like Tesla or Nvidia, crypto, and forex. The logic is the same across all of them.
Where should I put my stop loss?
Place your stop at a real market structure level, not just a few ticks from your entry. On the 5-minute chart, look for the low of the second candle after entry for longs, or the high for shorts. Avoid stops that are so tight that normal price wiggle takes you out.
What if I get stopped out? Should I re-enter?
Yes, you can. If price stops you out but then closes back through the level in your original direction, that is called a reclaim or re-entry setup. Wait for that candle close, then enter again with the same plan.
How do I know if the candle break is strong enough to trade?
Look at how the candle closes. A strong candle close means the body of the candle has clearly moved through the level. A weak close means the candle barely moved or left a long wick. Only trade strong closes.
Do I need indicators for this strategy?
No. This strategy uses only price levels. The only things on your chart should be the high and low of the first 5-minute candle. Too many indicators create conflicting signals and cause hesitation.
What is the minimum risk-to-reward I should target?
Aim for at least a 1:2 risk-to-reward ratio. That means for every dollar you risk, you are targeting two dollars in profit. This gives you room to be wrong some of the time and still be profitable overall.