Top-Down Analysis: How to Trade Lower Time Frames With a Higher Time Frame Bias
What Is Top-Down Analysis?
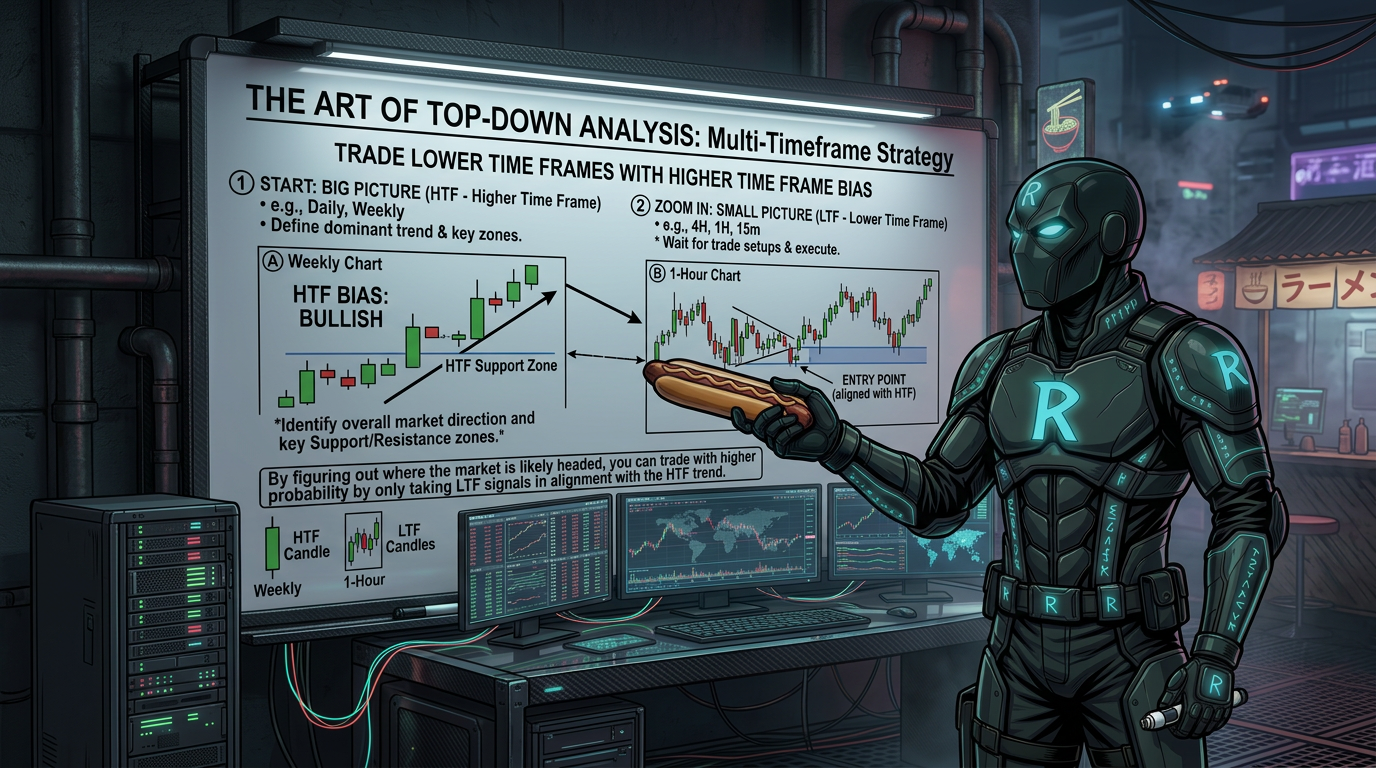
Top-down analysis is a method where you start with a higher time frame chart and work your way down. You figure out the big-picture direction first. Then you look for short-term trade opportunities that line up with that direction.
Think of it like a road trip. The weekly chart is your map. The 5-minute chart is the street you're driving on. If you only look at the street, you might take wrong turns. The map keeps you pointed the right way.
Having a high time frame bias does not mean you only take one trade per month. It means every short-term trade you take is backed by a bigger idea.
Why Most Traders Skip This Step
New traders often go straight to the lowest time frame they can find. They look for as many setups as possible. This leads to confusion, overtrading, and flipping biases constantly.
When you only watch the 5-minute chart, every small move against you feels like a trend reversal. You second-guess yourself and switch directions. This is one of the most common and costly trading mistakes.
Experienced traders say to start with the higher time frame for a reason. It took the video creator years of wasted effort to finally listen to that advice.
A Real Example: Aussie Dollar in 2024
In the fall of 2024, the Aussie dollar broke above a major 2023 swing high on the weekly chart. But then it closed back below that level. That one weekly candle told a big story.
When price fails to hold above a key high and closes back inside the range, it signals weakness. The likely target becomes the liquidity sitting at the lows of the range. This is called a draw on liquidity.
Over the next 10 weeks, the market moved lower and lower toward that target. That 10-week move created dozens of short trade opportunities on the lower time frames.
How to Trade Lower Time Frames With a High Time Frame Bias
Once you know the higher time frame direction, you can drop down to a 1-hour or 15-minute chart and look for entries. During that 10-week Aussie dollar drop, there were many short setups on the way down.
The market would rally up, take out short-term highs, trap buyers, and then fall again. Each of those rallies was a chance to enter short. Without the weekly bias, those rallies might have fooled you into going long.
With the big picture in mind, you know those short-term pops are just fuel for the next leg lower. You stop fighting the market and start working with it.
Better Risk-to-Reward When You Trade With the Trend
When you trade in the direction of the higher time frame, your risk-to-reward improves. Trades run further in your favor. Your stop-loss is easier to manage.
If the market is in a 10-week downtrend, shorting at the top of a short-term rally gives you a much bigger potential reward than a quick counter-trend long. The market is constantly moving to trap people on the wrong side. Being on the right side makes a huge difference.
The goal is to let the higher time frame draw on liquidity drive 90% of your decisions. Everything else is just noise.
Putting It All Together: The Top-Down Process
Start with the weekly chart. Identify key highs, lows, and ranges. Figure out where price failed and where the next likely draw on liquidity is.
Move to the daily chart. Confirm the direction. Look for structure that supports your weekly idea.
Then drop to the 4-hour, 1-hour, and 15-minute charts. Look for entry setups that line up with the direction you identified above. This layered approach keeps you in sync with the market at every level.
Frequently Asked Questions
Does top-down analysis mean I can only take a few trades per month?
No. Your higher time frame gives you a direction, but you still trade on lower time frames. During a 10-week trend, there can be dozens of short-term setups that all line up with your big-picture bias.
What time frame should I start with?
Most traders start with the weekly chart to get the big picture. Then they move to the daily, 4-hour, 1-hour, and lower. The key is to always start higher and work your way down.
What is a draw on liquidity?
A draw on liquidity is a price level the market is likely heading toward. It is usually an old high or low where a lot of stop orders or pending orders are sitting. Once you identify it, it helps you stay focused on direction.
Why does the market keep making short-term rallies during a downtrend?
Short-term rallies trap buyers and generate buying interest. Smart money uses that interest to sell into. Once buyers are trapped, the market falls again. These rallies are opportunities to enter in the direction of the trend.
What does it mean when price takes out a high and then closes back inside the range?
It means the breakout failed. Price faked out buyers and then reversed. This is often a signal that the market is heading in the opposite direction, toward the lows of the range.
How do I stop flip-flopping between long and short?
Anchor your bias to the higher time frame. Write down your weekly or daily direction before you trade. When a lower time frame candle goes against you, check your higher time frame first before changing your mind.
Can I use top-down analysis for day trading or scalping?
Yes. Even if you scalp on a 5-minute chart, knowing the weekly or daily direction helps you avoid trades that fight the trend. You take trades that work with the market instead of against it.
Why is risk-to-reward better when trading with the higher time frame trend?
When you trade in the direction of the trend, the market is more likely to move further in your favor before reversing. This means you can target bigger profits while keeping your stop-loss tight.