How to Trade the 4-Hour Power of Three (AMD)
What Is the Power of Three (AMD)?
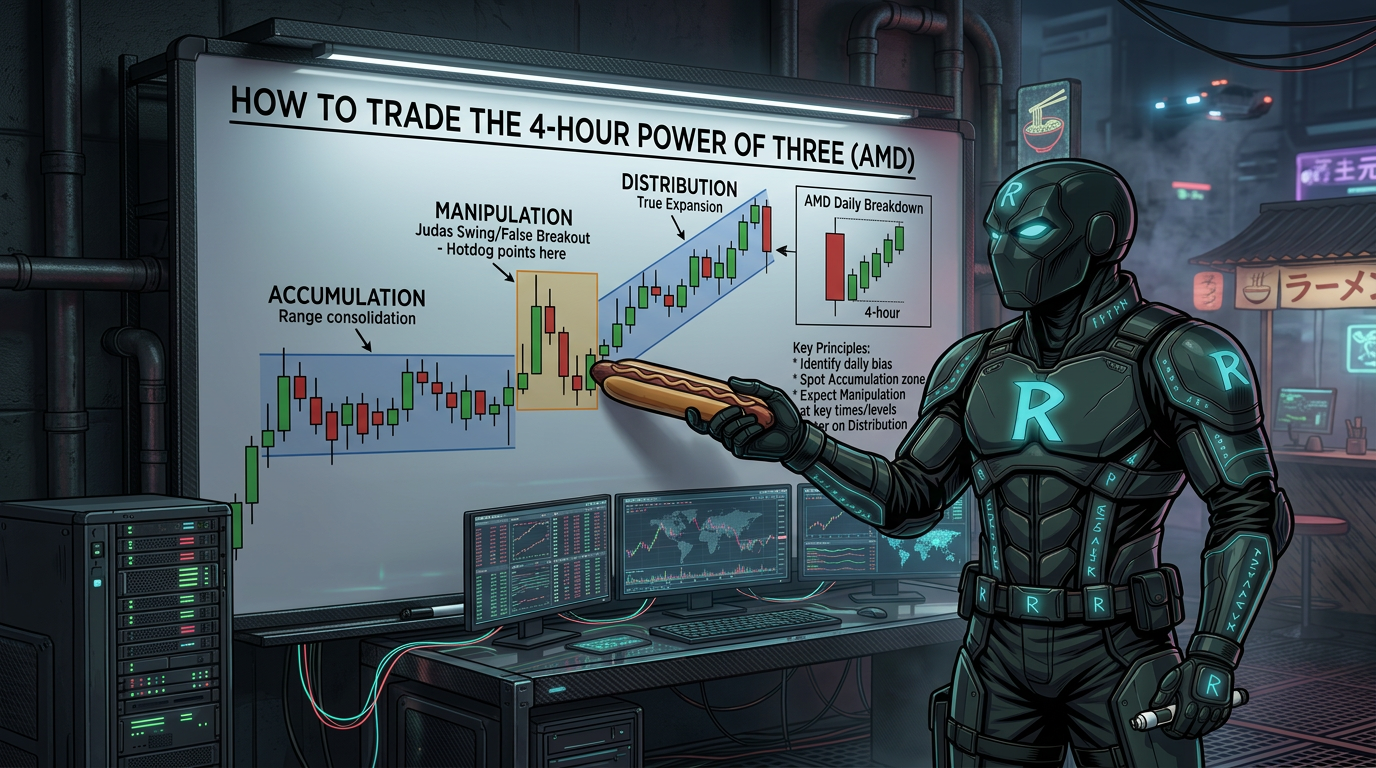
AMD stands for Accumulation, Manipulation, and Distribution. These are three phases that often play out inside a single higher time frame candle.
Accumulation is a consolidation or resting phase. Manipulation is a move against the expected direction — a fake-out or wick. Distribution is the real move, also called the expansion.
Your goal is to skip the manipulation and trade the distribution. You want to let the wick form, then trade the body.
The Two Main Scenarios
There are two ways the AMD pattern plays out on a 4-hour chart.
Scenario one: Candle 2 has a large opposing run. This means the wick is too big to trade inside that candle. You wait for Candle 2 to close and then trade Candle 3 as the expansion candle.
Scenario two: Candle 2 has a small, shallow opposing run. This means the manipulation and distribution happen inside the same candle. You can look to trade the expansion within Candle 2 once its wick is confirmed.
What Is a Protected Swing?
A protected swing forms when price makes a shallow opposing run and then shows a change in the state of delivery. This means the direction has flipped on the lower time frame.
When a protected swing forms, you can treat that wick as finished. Price is less likely to return to that low or high. That gives you a place to set your stop loss.
If you see a protected swing early in a candle, it supports expansion in the opposite direction for the rest of that candle.
4-Hour Candle Timing for Futures and Forex
The 4-hour candles open at specific times depending on what you trade. For futures, the key candle openings are at 2:00 AM, 6:00 AM, 10:00 AM, 2:00 PM, and 6:00 PM Eastern.
For forex, the timings shift slightly. Knowing these times helps you anticipate when the wick forms and when to look for your entry.
Always align the 4-hour candle bias with your daily bias. The daily direction should match what you expect the 4-hour candle to do.
Using Lower Time Frames to Enter
Once you know which 4-hour candle should expand, drop down to a lower time frame to find your entry. The 15-minute chart pairs well with the 4-hour for most traders.
You can also use a 3-minute or 5-minute fractal model to confirm that the wick of the 4-hour candle has formed. Look for a sweep of a key level followed by a change in the state of delivery.
Once you see that confirmation on the lower time frame, you can enter with your stop loss on the protected swing and target a nearby level like the previous day's high or low.
Real Example: Candle 3 Continuation (Futures)
On a bullish daily setup, price forms a reversal candle during London session (around 2:00 AM). This sets up a New York continuation at the 6:00 AM candle open.
The 6:00 AM candle opens and makes a large opposing run lower, forming a reversal candle. This signals to wait for Candle 3 at the 10:00 AM open.
At 10:00 AM, price opens and makes a shallow low. A protected swing forms on the lower time frame. You enter long with your stop on that low and target the previous day's high.
Real Example: Reversal-to-Expansion in Forex (USDJPY)
On a bullish weekly setup, look for a shallow opposing run at the start of the new 4-hour candle. If price goes up first and then comes back down, that is often a sign the expansion will come after.
Wait for expansion met with a change in the state of delivery. This confirms the reversal point. From there, look for a continuation entry using a protected swing on the lower time frame.
Keep your target realistic. Expansion candles have limited range and limited time. Do not hold past the next candle open unless you have a fresh setup.
Using the Fractal Model with the 4-Hour (GXT Style)
Some traders combine the 4-hour AMD profile with a lower time frame fractal model. This is sometimes called GXT — using the 4-hour structure with a fractal entry model.
On the 3-minute or 5-minute chart, look for consolidation near the expected wick area. Wait for the consolidation highs or lows to be swept and then look for a change in the state of delivery.
This gives you a precise entry while staying aligned with the larger 4-hour direction. Your stop goes on the protected swing and your target is 2R or the nearest key level.
Key Rule: Let the Wick Form, Then Trade the Body
The most important rule in this strategy is simple: do not try to catch the wick. If you keep trying to pick the exact bottom or top of the wick, you will get stopped out repeatedly.
Instead, wait for the wick to finish forming. Look for confirmation that price has reversed. Then enter in the direction of the expected body.
This patience is what separates consistent traders from those who get chopped up. The setup is only valid once the wick is confirmed.
Frequently Asked Questions
What does AMD stand for in trading?
AMD stands for Accumulation, Manipulation, and Distribution. These are the three phases that play out inside a candle. Accumulation is the resting phase, manipulation is the fake move or wick, and distribution is the real expansion move you want to trade.
When should I trade Candle 2 vs Candle 3?
Trade Candle 2 only if it has a small, shallow opposing run and forms a protected swing. If Candle 2 has a large opposing run, wait for it to close and trade Candle 3 as the expansion candle instead.
What is a protected swing?
A protected swing forms when price makes a shallow move against the expected direction and then shows a change in the state of delivery. This signals that the wick is likely finished and price can now expand in the intended direction.
What time frames work best with this strategy?
The 4-hour and 15-minute pairing is the most straightforward. You can also use a 3-minute or 5-minute fractal model for more precise entries. For futures, key 4-hour candle times include 2:00 AM, 6:00 AM, and 10:00 AM Eastern.
How do I know where to put my stop loss?
Place your stop loss on the protected swing low or high. This is the point where the wick is confirmed to have formed. If price trades back through that level, your trade idea is invalidated.
Why do I keep getting stopped out when trading the wick?
Trying to catch the wick means you are entering before it is finished forming. The wick can extend further before reversing. Wait for a change in the state of delivery and a confirmed protected swing before entering.
How do I align the 4-hour setup with the daily bias?
Start on the daily chart and determine if the overall direction is bullish or bearish. Then use the 4-hour candles to look for a reversal candle followed by a continuation candle in that same direction. Only take trades that match both time frames.
Can I use this strategy on forex pairs as well as futures?
Yes. The AMD model works on both futures and forex. The main difference is the candle open timing. Forex uses slightly different session times, so adjust your 4-hour candle markers accordingly before looking for setups.