How to Trade the 9:30 Open Using the First Candle Strategy
Why Simple Strategies Work Better
Many traders lose money because they overcomplicate things. They add too many indicators like MACD, RSI, and Bollinger Bands to their charts. They jump from strategy to strategy without sticking to one. The truth is that every strategy can work if you follow it consistently. Less is more in trading. Price action itself is the most important signal on your chart.
What the First Candle Tells You
The first 5-minute candle of the New York session opens at 9:30 AM EST. This candle has the highest trading volume of the day. That volume makes it the most reliable candle to base a trade on. It tells you the likely direction of the market for the next 90 minutes. It also gives you a precise entry point and helps you avoid false moves right at the open.
Why Focus on the New York Session
There are three main trading sessions: pre-market (London), New York regular hours, and after-hours (Asia). The New York session has the most volume by far. Volume spikes sharply at 9:30 AM and then tapers off. That volume spike is what makes the first candle so powerful. This strategy works on stocks, futures, options, forex, and crypto, but the 9:30 AM EST time is tied to the New York Stock Exchange open.
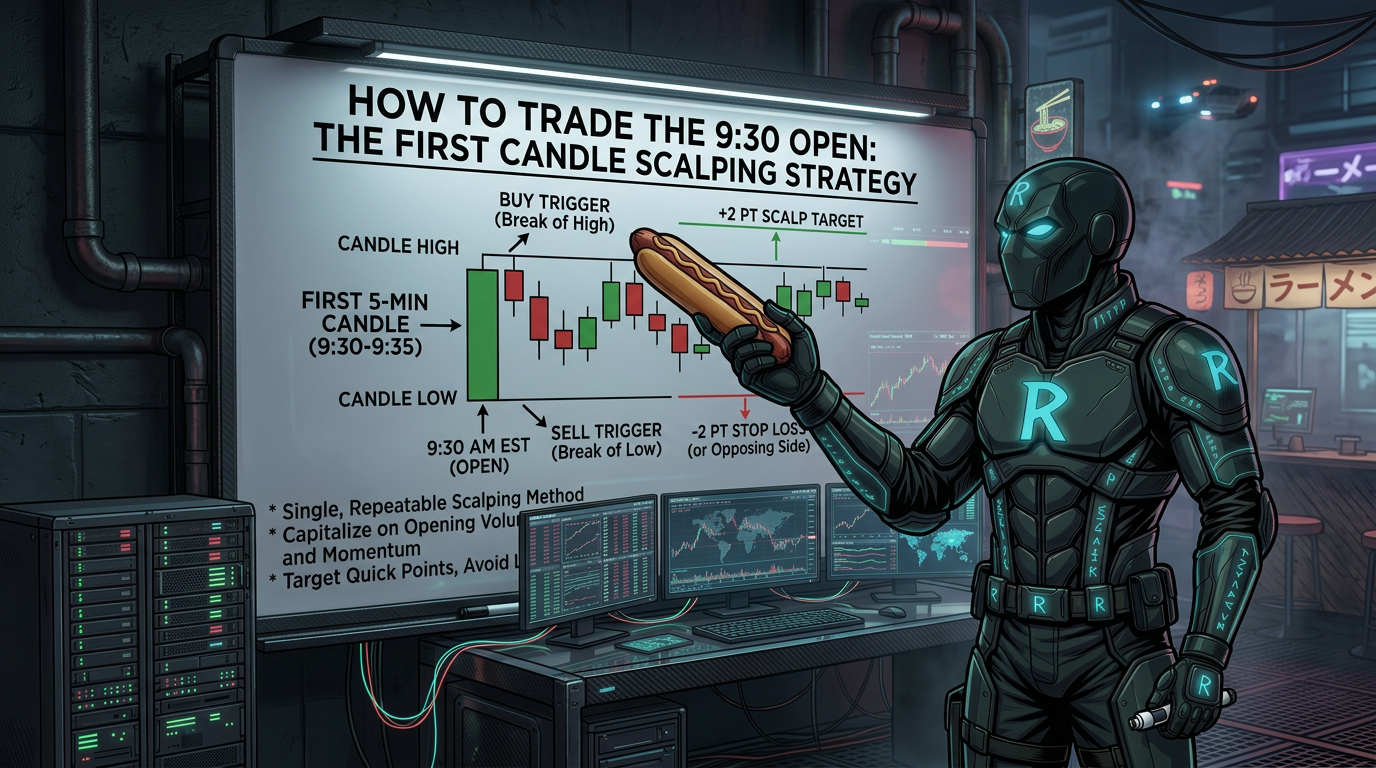
Step 1 – Mark the High and Low of the First 5-Minute Candle
Switch to the 5-minute chart. Wait for the 9:30 AM candle to fully close. This takes 5 minutes, so the candle closes at 9:35 AM. Draw a horizontal line at the high of that candle. Draw another line at the low of that candle. These two lines form your range. You are now waiting for price to break above or below this range.
Step 2 – Wait for a 1-Minute Candle to Close Outside the Range
Switch to the 1-minute chart. Watch for a 1-minute candle to close above the 5-minute range high. That signals a potential move up. Or watch for a 1-minute candle to close below the 5-minute range low. That signals a potential move down. Do not enter a trade yet. This close only tells you the direction. You still need one more confirmation before entering.
Step 3 – Wait for a Retest, Then Enter
After the break, price will often come back to retest the level it just broke. If price broke above the range high, wait for it to pull back to that high. If price broke below the range low, wait for it to pull back to that low. When price returns to that level and shows a reaction, that is your entry. Place your stop loss on the other side of the range. Target at least a 1:2 risk-to-reward ratio. That means if you risk $100, you aim to make $200.
Real Trade Examples on Tesla
The strategy was demonstrated on Tesla across multiple trading days. In each example, the 5-minute range was marked at 9:35 AM. Price then broke in one direction. It retested the broken level. Sellers or buyers stepped in. The trade moved toward the target at a 1:2 ratio. Some days price came back to retest the level twice before continuing. The setup repeated cleanly each day without any indicators.
How to Practice This Strategy
The best way to build confidence with this strategy is to backtest it. Pull up a 5-minute chart on any stock or futures instrument. Find the 9:30 AM candle on past dates. Mark the high and low. Look for the break and retest pattern. Track what would have happened with a 1:2 target and a stop on the other side of the range. Do this for at least 20 to 30 days of data before trading it live.
Frequently Asked Questions
What time does the first candle form?
The first candle opens at 9:30 AM Eastern Standard Time and closes at 9:35 AM. That is when you mark the high and low and start looking for a breakout.
Does this strategy work on stocks other than Tesla?
Yes. The strategy can be applied to any stock, futures contract, forex pair, or crypto asset. The key is using the 9:30 AM EST open for US markets. You may need to adjust the time for other markets.
Do I need any indicators to use this strategy?
No. You only need a 5-minute chart and a 1-minute chart. You draw two horizontal lines on the first candle and watch for price to break and retest those levels.
What is a 1:2 risk-to-reward ratio?
It means you risk a smaller amount to make twice as much. For example, if your stop loss would cost you $100, your target should be at least $200. This way you can still be profitable even if you lose some trades.
What if price never comes back to retest the level?
If there is no retest, there is no trade. Do not chase price. Missing a trade is better than forcing a bad entry. Another setup will appear the next day.
How do I know if the retest is valid?
Look for a strong reaction candle at the level. This might be a candle that closes back in the direction of the trend, an upper or lower wick rejecting the level, or a clear slowdown in momentum at that price.
Can I use this strategy as a complete beginner?
Yes. It is designed to be simple and mechanical. There are only three steps and no indicators required. Beginners should practice on paper trades or backtesting before using real money.
What is the best way to practice before trading live?
Go back through historical charts and mark the 9:30 AM candle on past days. Track the break and retest setups. Record your results. Doing this for 20 to 30 days of data will help you understand how the strategy performs.